Read the measure behind the property-market headline
Read a dated Costa del Sol market notebook with official municipal transaction counts, national price-index context, methods, source records and plotted data.
At a glance
- Distinguish prices, counts, periods and administrative geography.
- Inspect selected 2025 municipal records and Q2 2026 national context.
- Download plotted values with source, release and retrieval information.
A property-market headline can describe a national price index, a municipality’s transactions, an advertiser’s asking prices or a valuation series. Those measures answer different questions. This Costa del Sol notebook begins with a published method, then a dated first edition using official sources. It gives readers the numbers, the geography and the limitations together, so that a market figure does not become an unsupported conclusion about a particular home.
The first edition is dated 10 November 2026. It combines selected municipal transaction counts for 2025 with national price-index context for the second quarter of 2026. The periods are deliberately labelled separately. It is not a live listing feed, a complete coastal market census or a prediction. Downloads below contain the exact values plotted, source links and the retrieval date, allowing the illustrations to be checked and reused with their attribution.
Method: identify the measure before interpreting it
Start every research entry with the publisher, dataset, variable, unit and period. Identify whether it records completed transactions, registered events, asking prices or appraised values. Do not rename one measure as another because the result looks convenient. A count of transactions says how many events fall within that statistical definition; it is not a count of homes currently available or a direct measure of the time needed to sell.
Use the valuation and negotiation guide when applying evidence to a sale. Keep the comparable properties, condition, inclusions and dates visible. An index provides context for a discussion, while a proposed asking figure for a particular home still needs its own basis. Do not multiply an old advert by a general percentage and present the result as a verified current valuation.
Method: keep the geographical boundary explicit
A municipality, province, autonomous community and country are different boundaries. Marbella municipality is not simply a named neighbourhood, and Málaga province is not interchangeable with every use of the Costa del Sol label. This notebook names the administrative unit used for each number. It does not infer neighbourhood performance from a municipal total or a coastal conclusion from a national rate.
The area guide directory supplies practical local context. Use it to investigate daily routes and property types, rather than treating transaction volume as a location recommendation. When two towns have different totals, their sizes, housing stocks and mix may also differ. Raw counts should not be called a popularity ranking or a measure of how easy it will be to resell a specific property.
Method: record the period and the version
Keep the observation period separate from the source publication date and the date this notebook was prepared. A page viewed in November can contain an annual measure for the previous year. Where a source revises information, retain the earlier edition and explain the change before updating a chart. A later publication can also contain a different definition or base rather than a directly comparable replacement.
For the first edition, the municipal pages display a 2025 reference year; a source publication date for those individual cells was not stated in the inspected presentation. That absence is recorded rather than invented. The national release states its own publication date. Future editions should keep these same fields and explain any changed source, geography or measure before a trend is calculated.
First edition: three municipal transaction records
The IECA SIMA municipal pages report the following 2025 counts for new and second-hand housing transactions. The SIMA variable explanation identifies the transaction-statistics basis and its unit as dwellings. These are selected municipal observations, not the Costa del Sol total. No prior-year comparison or price conclusion is calculated from this table.
| Municipality | New housing transactions, 2025 | Second-hand transactions, 2025 |
|---|---|---|
| Marbella | 450 | 3,949 |
| Estepona | 888 | 2,578 |
| Fuengirola | 621 | 1,548 |
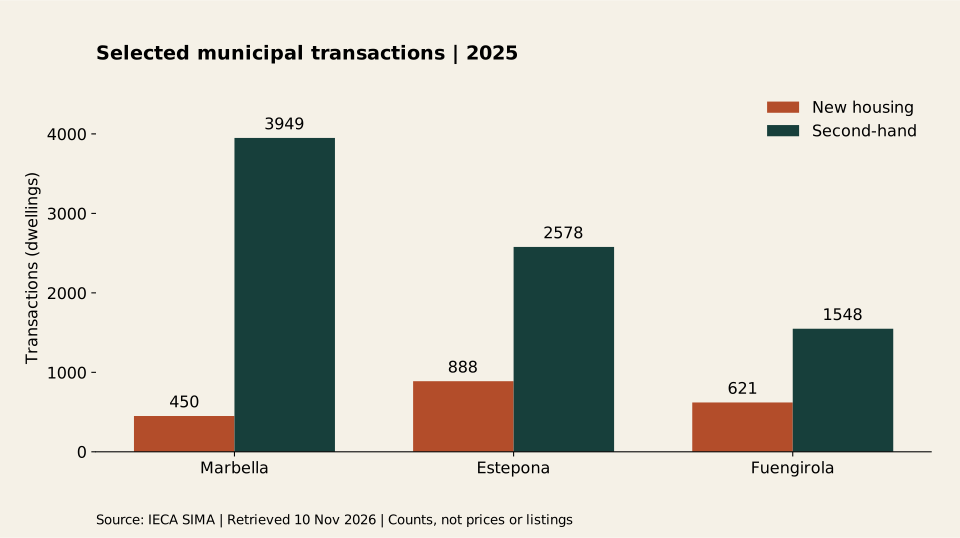
Source: Instituto de Estadística y Cartografía de Andalucía, SIMA, with the underlying provider identified in its variable metadata. Retrieved 10 November 2026. Download the plotted municipal data and source record. The chart places the two categories beside each municipality without treating a larger category as a better investment.
First edition: national price-index context
INE’s second-quarter 2026 IPV release, published 7 September 2026, reports annual rates of 12.2% overall, 7.4% for new housing and 12.9% for second-hand housing. These are Spain-level year-on-year index changes, not Costa del Sol or municipal price changes. The index base is 2025. They are not euro-per-square-metre prices or gains achieved by an individual owner.
| Spain IPV category | Q2 2026 annual change |
|---|---|
| All housing | 12.2% |
| New housing | 7.4% |
| Second-hand housing | 12.9% |
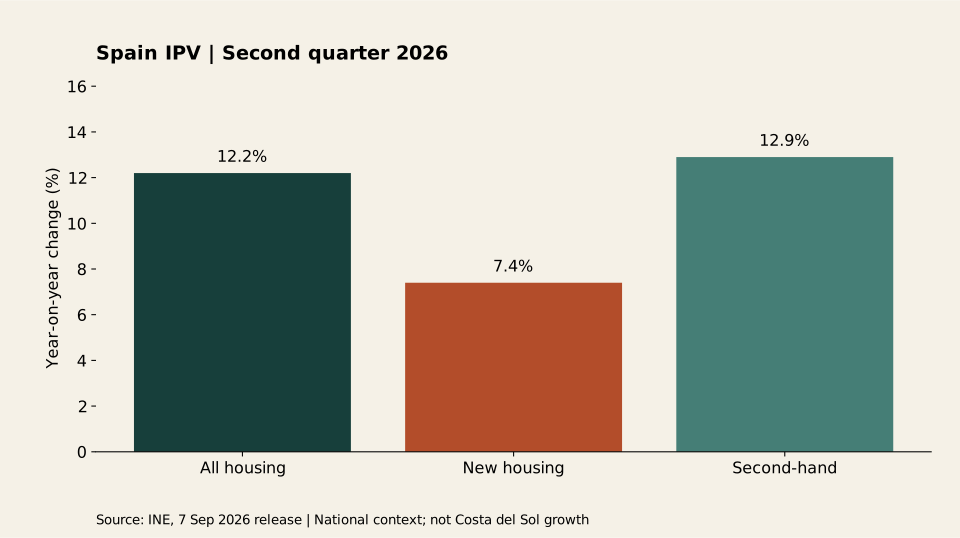
Download the plotted national values. Source: INE; original presentation by Costa del Sol Property Guide. Reuse follows the INE attribution conditions, including the source and release date. INE does not endorse this notebook. The national series is displayed separately from the municipal counts because the unit, period and geography differ.
Ask what the evidence still cannot answer
Neither chart establishes the condition of a candidate home, the owner’s negotiating position, a future rental permission or the costs of a building project. The municipal table contains no transaction prices, while the national chart supplies no street-level comparison. Use the bargain property guide to test an advertised reduction and the mortgage valuation guide to distinguish a lender-related assessment.
A home’s proposed income and exit need separate assumptions. Read growth versus income and checking projections before importing a headline into a forecast. A recorded price movement cannot establish that a future buyer will pay the value entered in your model. Keep the source observation and the scenario assumption on different lines.
Use the notebook with a property decision
For a live search, keep a dated candidate record and the evidence relevant to that property. The duplicate listing guide helps reconcile conflicting adverts. The comparison workspace records observations, reported claims and checked information separately. This notebook supplies context for those records; it does not replace the legal or technical questions associated with the individual home.
For a household budget, use the complete ownership workbook with checked cost inputs. The market charts do not feed a hidden appreciation rate into that tool or the buy/rent/wait comparison. If you choose a future sale assumption, state it explicitly and examine alternatives rather than presenting the historical index as a promise.
Keep the next edition comparable and honest
The notebook is a dated research series with manual review, not an automated feed or a promised publication schedule. A future edition should update the source record, preserve this edition’s data, and flag revisions or definition changes. Where comparable local information cannot be verified, leave the conclusion open rather than filling the gap with estimated sold prices. The downloadable records make that boundary visible from the first edition.
No market-wide coverage, independent professional review or forecast accuracy is claimed. This first edition establishes a small reproducible baseline, explains its limits and connects it to the existing Costa del Sol guidance. The next useful research question is whether a genuinely comparable later observation exists, not how to turn a partial table into a stronger headline.
Retain a short research question with every chart
Write the question the chart can address before writing the headline. For the municipal illustration, that question is how the two reported transaction categories differ across these three named municipalities in the stated year. For the national illustration, it is how three published annual index changes compare in the stated quarter. Neither question asks which street is undervalued. Keeping that distinction in the research record makes a later update easier to check and helps prevent a useful small observation from acquiring a much broader claim as it passes into marketing copy or a household discussion.